Loki
Grafana Loki is a log aggregation tool. There have been many in the past, but Loki provides a well-integrated and easy-to-maintain experience in the open-source landscape.
Grafana filled the UX gap in cloud native tools with great timing and execution: in Grafana, you can find all three legs of observability.
Querying
Querying basics
In Loki's LogQL first you select a log stream, then pipe it with various filter criteria.
Grafana's Explore view is just the place to try out your queries.
Selecting a log stream
Log stream selectors are very similar to Prometheus's label based selectors. In Loki, the log stream has no name, you can start writing the label selectors:
{namespace="default"}
Then pipe in further criteria
The query below selects logs from the default namespace and filters the logs to return only the ones that contain the "Exception" string.
{namespace="default"} |= "Exception"
You can find the well-known operators in LogQL too:
|=Log line contains string!=Log line does not contain string|~Log line contains a match to the regular expression!~Log line does not contain a match to the regular expression
tip
Mastering your tools pays dividends for a long time. When time allows, go and do a deeper dive into LogQL.
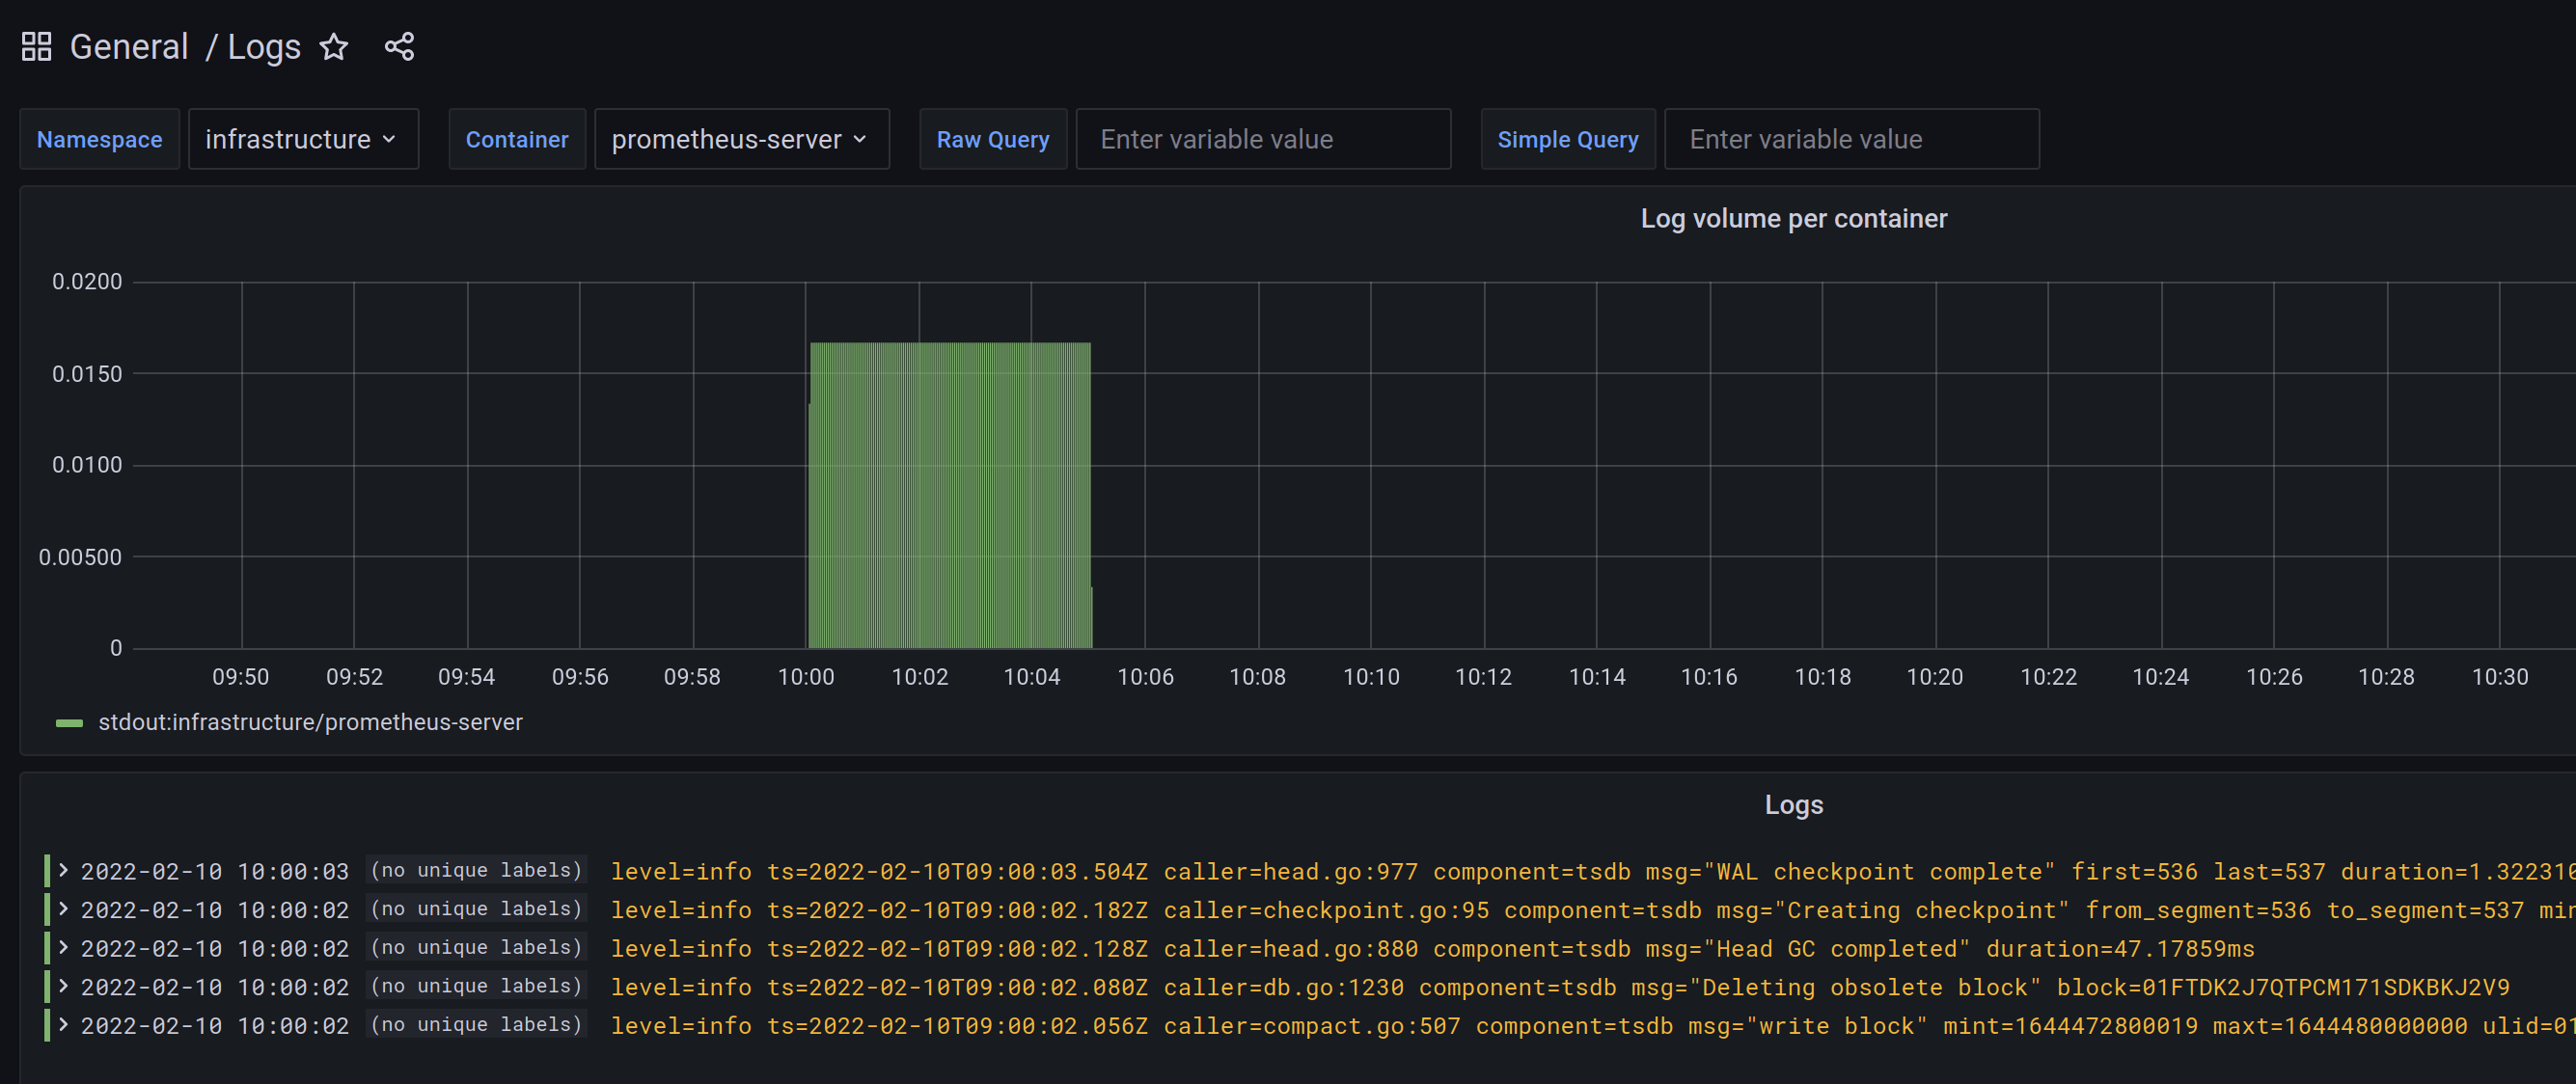
Simplified log querying with Gimlet Stack dash 
If you install Loki with Gimlet Stack, a Logs dashboard is also installed. On this dashboard, you can query logs without much knowledge of LogQL.
It has a namespace, a container filter built in, and two querying fields:
- in the raw query field, you can type standard Loki LogQL queries.
- in the simple query field, you can type any string which is going to be matched like the following regex:
.*$simple_query.*, basically meaning every log line where the given string is present.
Logs as metric sources
If you apply a function on the log queries you have, it will create metrics from logs.
Such functions are:
rate(log-range): calculates the number of entries per second.bytes_rate(log-range): calculates the number of bytes per second for each stream.
With these, you can create alerts on an unusually high number of logs:
rate({namespace="default"}[5m])
or check, if a specific error message popped up:
rate(namespace="default"} |= "MyException"[1m])
tip
See the full documentation or get inspired by examples.
Installation
Helm chart
See the Helm chart installation instructions.
Gimlet Stack
You can use Gimlet Stack to install Loki.
With Gimlet Stack, you get a proven setup with configurable persistence options backed by:
- a volume
- or a cloud bucket