Prometheus
Prometheus is the de facto standard of gathering metrics from Cloud Native stacks. There is a wide range of "exporters" available for Prometheus, and it is able to store an extensive number of metric series.
Pull model
Prometheus scrapes metric sources on a predefined interval. Every fifteen seconds, it iterates both its static and dynamically discovered targets and scrapes the /metrics web endpoint on them.
Prometheus inverts the logic used by most monitoring solutions: instead of applications reporting metrics to a centralized system, Prometheus has the responsibility to pull metrics from the sources.
Exporters
Prometheus pulls application metrics either from the application’s /metric endpoint or from a dedicated metrics exporter which has the sole responsibility of gathering metrics from a node or database, and expose them for Prometheus to pull.
We call these components exporters, and there exists a wide range of them. Most notably the node_exporter project that exposes operating system metrics. CPU, memory, and hundreds more.
The Prometheus data format
Prometheus has a simplistic, human-readable data format. You can observe it on the /metrics endpoint, and you will see a similar output to the following.
The snippet shows how the node_exporter exposes the operating system's load factor: currently the 1 minute load is 1.12, while the 15 minute load is 0.85.
# TYPE node_load1 gauge
node_load1 1.12
# HELP node_load15 15m load average.
# TYPE node_load15 gauge
node_load15 0.85
# HELP node_load5 5m load average.
# TYPE node_load5 gauge
node_load5 0.92
Service discovery
The last concept is service discovery.
Prometheus can work through a static list of host names or IP addresses:
global:
  scrape_interval: 15s

# A scrape configuration containing exactly one endpoint to scrape:
# Here it's Prometheus itself.
scrape_configs:
  # The job name is added as a label `job=<job_name>` to any timeseries scraped from this config.
  - job_name: 'prometheus'
    static_configs:
      - targets: ['localhost:9090']
  - job_name: 'nodes'
    static_configs:
      - targets: ['192.168.1.4:9090', '192.168.1.5:9090']
or can hook into service registries like the Kubernetes API server. That way, Prometheus is able to scrape every deployed pod, service, and node in the cluster.
The following yaml is an example of configuring Prometheus to discover pods in Kubernetes (kubernetes_sd_configs), and a set of relabel_configs to tell Prometheus what to do with the discovered metrics.
- job_name: 'kubernetes-pods'
  kubernetes_sd_configs:
    - role: pod
  relabel_configs:
    - source_labels: [__meta_kubernetes_pod_annotation_prometheus_io_scrape]
      action: keep
      regex: true
    - source_labels: [__meta_kubernetes_pod_annotation_prometheus_io_path]
      action: replace
      target_label: __metrics_path__
      regex: (.+)
    - source_labels: [__address__, __meta_kubernetes_pod_annotation_prometheus_io_port]
      action: replace
      regex: ([^:]+)(?::\d+)?;(\d+)
      replacement: $1:$2
      target_label: __address__
    - action: labelmap
      regex: __meta_kubernetes_pod_label_(.+)
    - source_labels: [__meta_kubernetes_namespace]
      action: replace
      target_label: kubernetes_namespace
    - source_labels: [__meta_kubernetes_pod_name]
      action: replace
      target_label: kubernetes_pod_name
info
Prometheus relable_configs is considered a dark art. This book tries to give you a practical intro to it in Understanding metric relabeling and scrape configs
Querying Prometheus
Your first query
Once you have Prometheus up and running, you understandably want to check out a few metrics. The quickest way to query Prometheus is to proxy Prometheus's basic dashboard to your laptop, and run queries on the UI.
You typically don't have Prometheus exposed for querying, and its UI is surely uninviting, it’s not even remotely as useful as Grafana. Still, it's just what you need to debug Prometheus.
kubectl port-forward svc/prometheus-server 9090:80
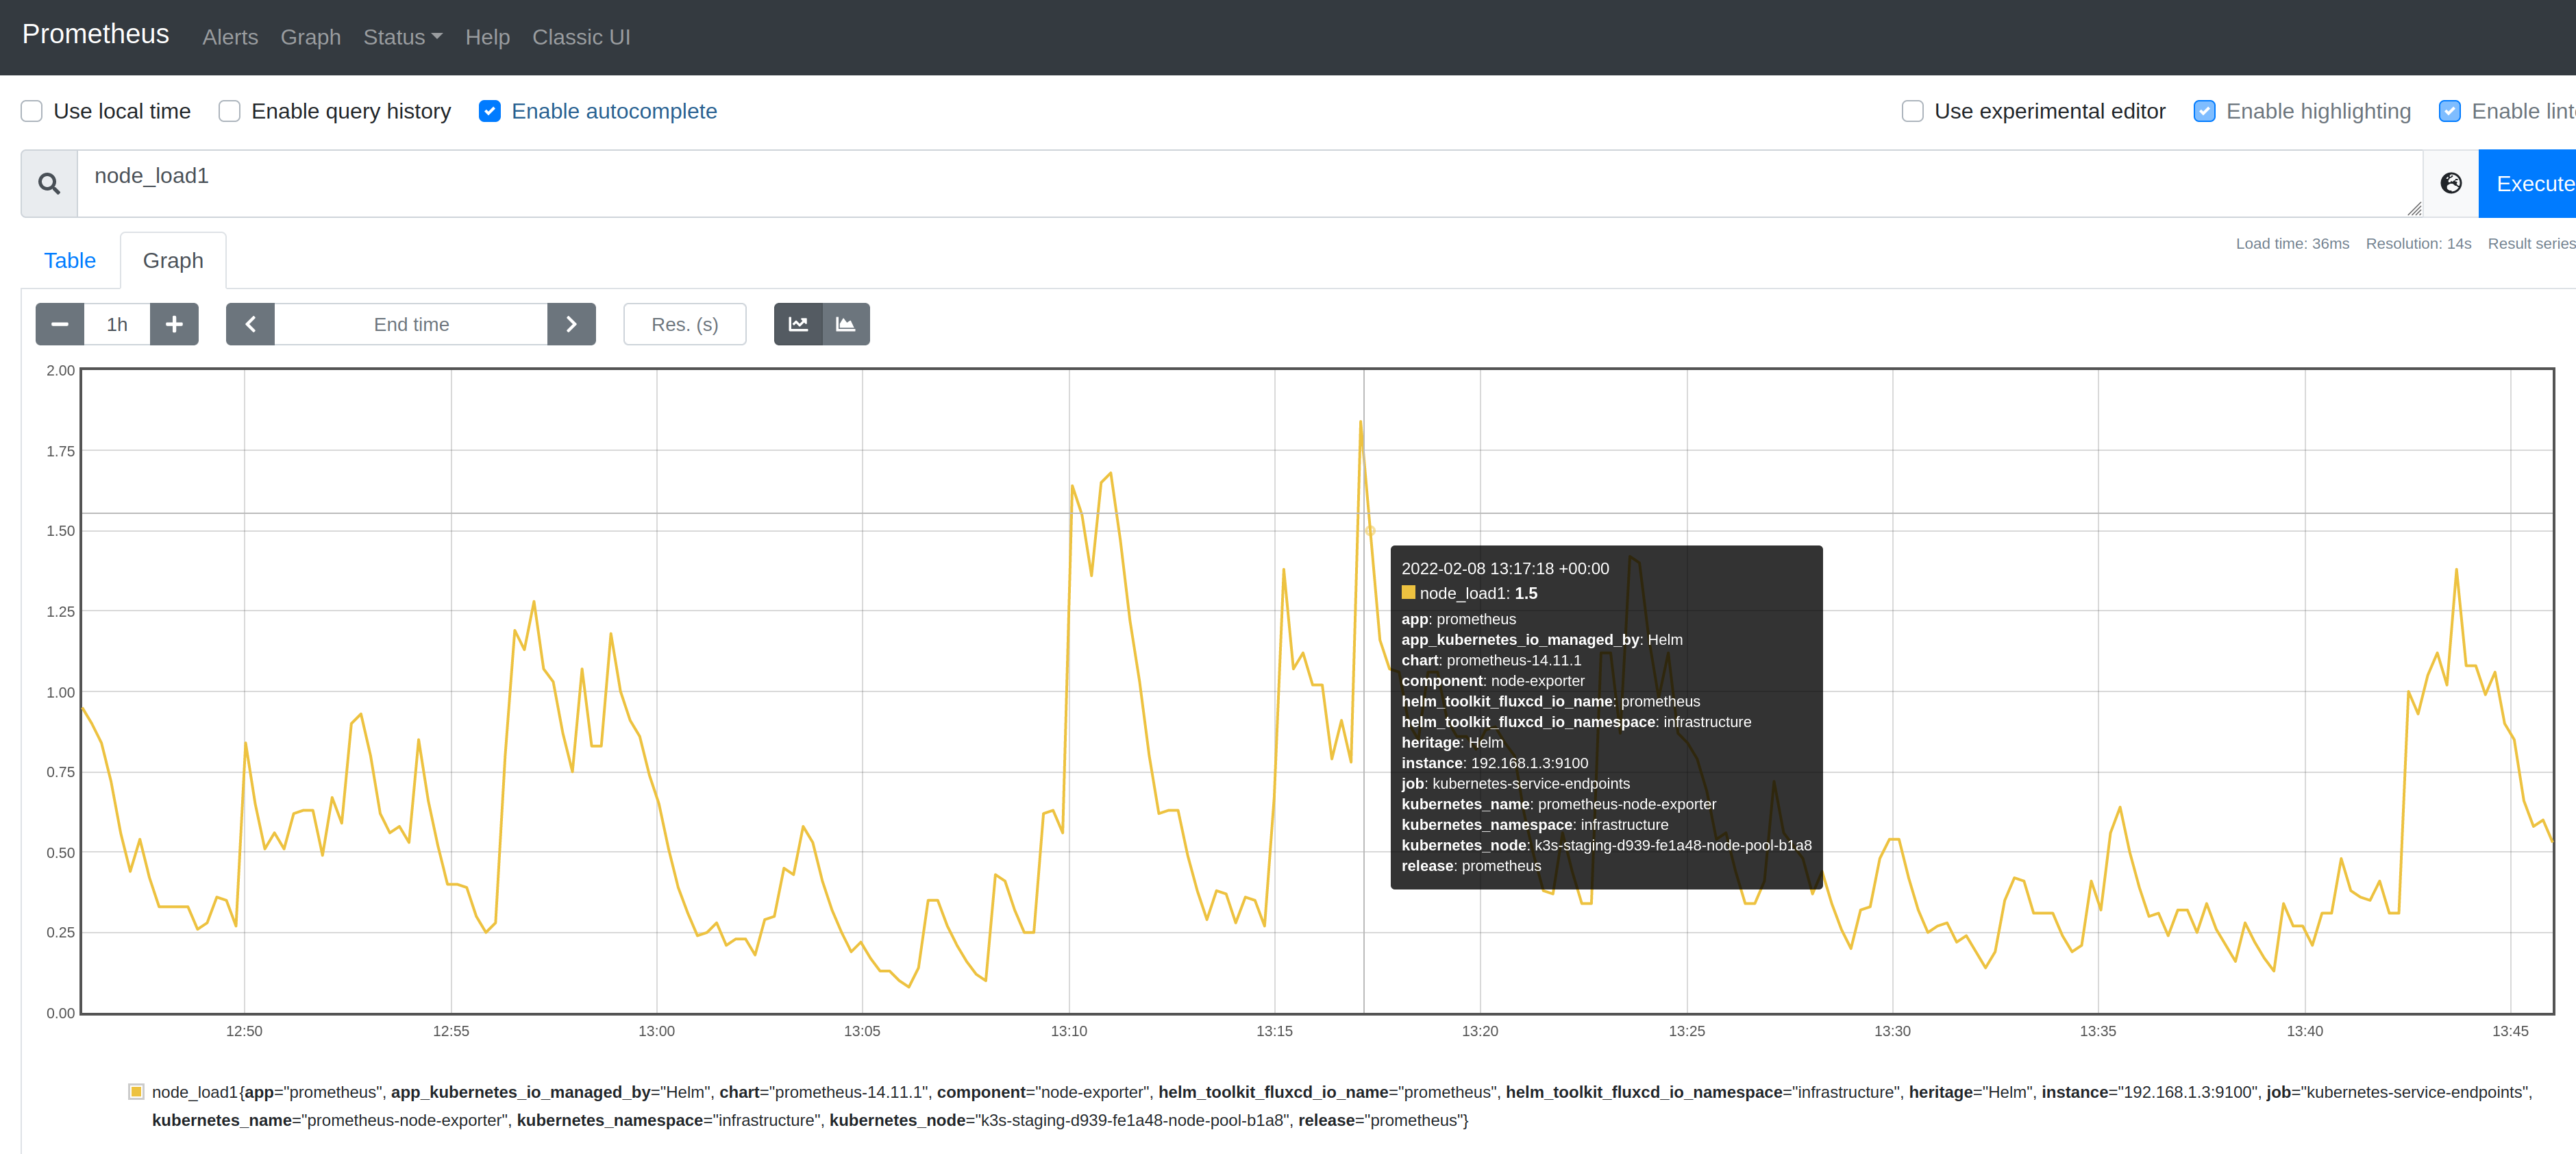
We are going to work with the node_load1 metric from the node_exporter project that shows the 1 minute load of monitored node.
Type node_load1 and inspect the graphs and its labels that showed up.
Filtering by labels
Labels are metadata for Prometheus metrics which you can also use for filtering.
When you inspected the node_load1 metric, you could see that multiple metric series showed up, because you have multiple nodes in your cluster. One for each unique label combination. You can use these labels to filter metric series to find the ones you are interested in.
The following label filter will show the metric series that belongs to the "mynode" instance:
node_load1{instance="mynode"}
Besides the equality operator, you can use the following ones as well:
=Select labels that are strictly equal to the provided string.!=Select labels that are not equal to the provided string.=~Select labels that regex-match the provided string.!~Select labels that do not regex-match the provided string.
Counters vs gauges
There are only a few metric types in Prometheus:
- counters
- gauges
- histograms
A gauge is a metric that represents a single value that can arbitrarily go up and down. Just like your car's speedometer, it tells you how fast your car is going at any given moment. node_load1 was a gauge metric, it showed how the 1 minute load changed over time.
Gauges are what you expect from a metric, counters, on the other hand, are a bit tricky, or more basic, to be precise: they are ever increasing numbers, representing how many times something has happened.
The prometheus_http_requests_total{handler="/metrics"} metric, as shown on the image below, counts how many times the /metrics endpoint was called on Prometheus.

The above chart is not very useful. Knowing the total number of times an endpoint was called is not what you typically want to know. The steepness of this curve, on the other hand, is much more useful. The rate at which an endpoint gets requests is much more interesting. You can use the rate function on counters to get just that piece of information.
tip
You could be wondering why the /metrics endpoint is called on Prometheus. Isn't Prometheus supposed to be the one scraping, essentially calling /metrics on other apps?
You guessed right, but Prometheus also scrapes itself for metrics. After all, having metrics from Prometheus itself is very useful.
The rate function
The rate function calculates the per-second average rate of increase of the time series in a given time range.
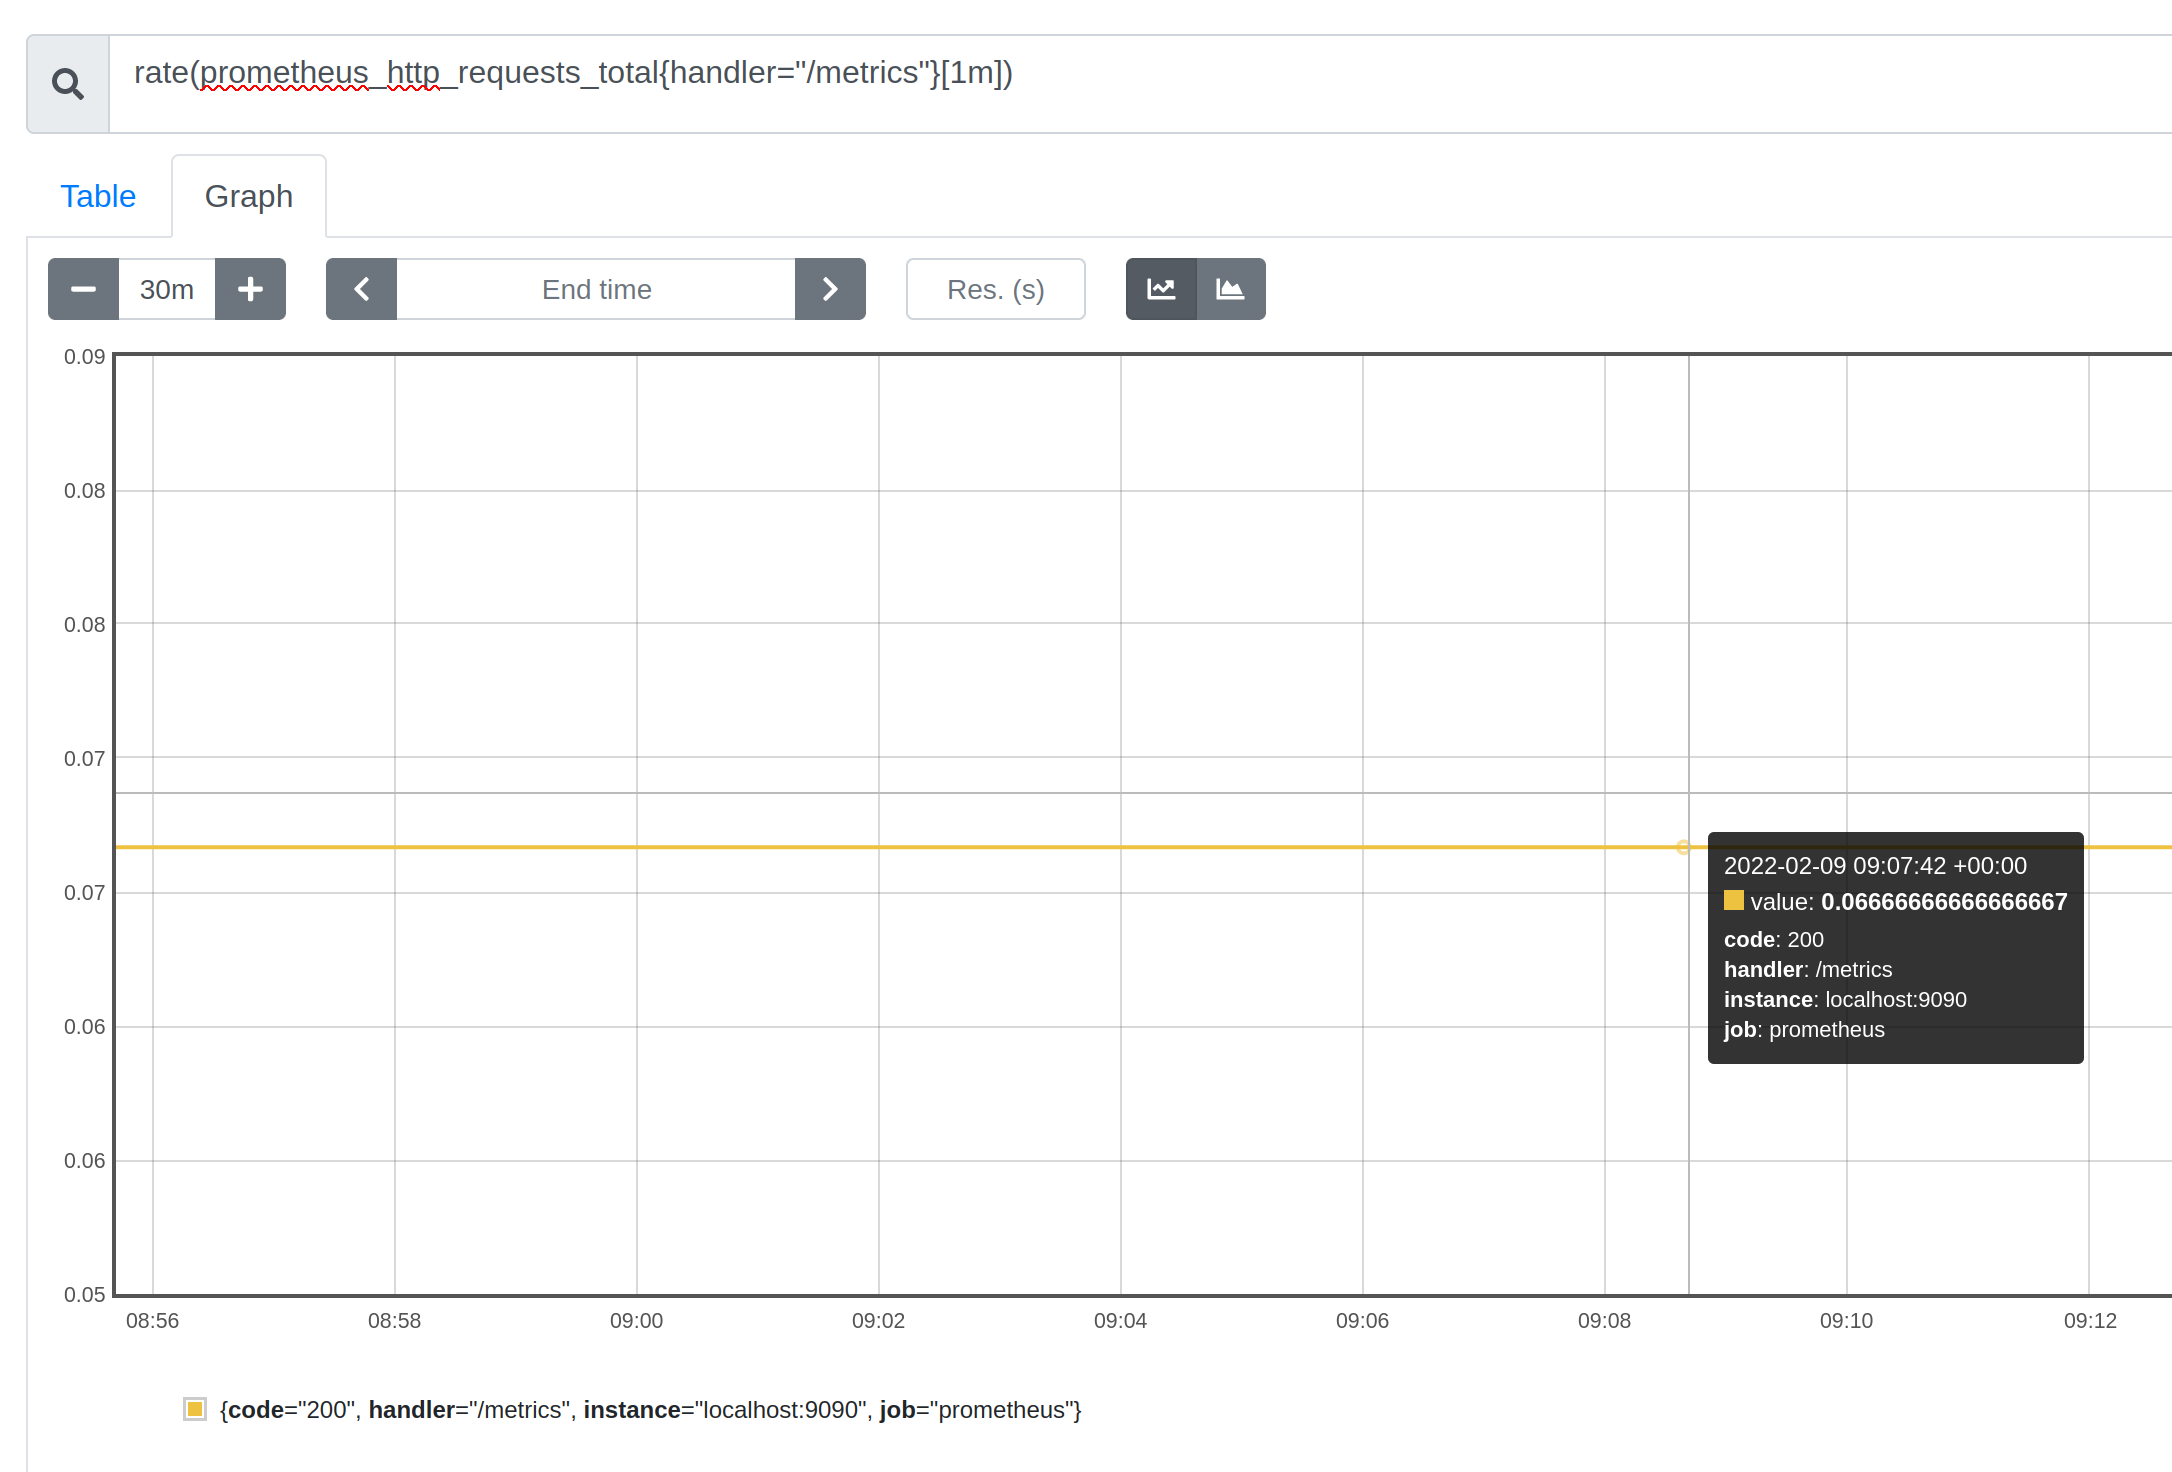
rate(prometheus_http_requests_total{handler="/metrics"}[1m])
The syntax for functions is what you would expect fn(timeseries) with the exception that you have to provide a time range for it too: fn(timeseries[range]), so it knows for every datapoint how far it should look back to calculate the rate.
The below image shows a flat 0.067 per-second rate, which stands for a single request in every 15 seconds. Which we know is the scraping rate of Prometheus, therefore, we can be confident that this metric is telling the truth.
info
What happens to the counters when the monitored application restarts? They reset. Luckily, the rate function is prepared for this, and you won't see a sudden drop in the rate at restarts.
Histograms
Histograms are the third type of metrics in Prometheus.
They are basically counters, but each metric has a special label, le which shows the predefined buckets the specific metric has.
Let's look at prometheus_http_request_duration_seconds_bucket{handler="/metrics"} which shows that this metric has 10 buckets, each showing the number of requests that are lower equal (hence the le label name) than the time in the label.
The counter with the le="1" label shows the number of requests served faster than 1 second, the counter with the le="0.4" label shows the number of requests served faster than 0.4 second, and so on. With these metrics, you can see the distribution of response times on the /metrics endpoint.
prometheus_http_request_duration_seconds_bucket{handler="/metrics", le="0.1"}
prometheus_http_request_duration_seconds_bucket{handler="/metrics", le="0.2"}
prometheus_http_request_duration_seconds_bucket{handler="/metrics", le="0.4"}
prometheus_http_request_duration_seconds_bucket{handler="/metrics", le="1"}
prometheus_http_request_duration_seconds_bucket{handler="/metrics", le="3"}
prometheus_http_request_duration_seconds_bucket{handler="/metrics", le="8"}
prometheus_http_request_duration_seconds_bucket{handler="/metrics", le="20"}
prometheus_http_request_duration_seconds_bucket{handler="/metrics", le="60"}
prometheus_http_request_duration_seconds_bucket{handler="/metrics", le="120"}
prometheus_http_request_duration_seconds_bucket{handler="/metrics", le="+Inf"}
The histogram can be most useful, if the distribution is charted over time in a heatmap widget in Grafana. See how you can do that
tip
Advanced querying
Joining metrics
Besides the basic queries above, I'd like to show you a fairly common approach: filtering based on labels that are not on the metric.
A typical use-case for this is when you want to query a pod metric based on custom pod labels that you added.
Take the container_memory_working_set_bytes metric. It shows how much memory your pod uses. It has several labels, like pod name, but the custom pod labels you add to pods do not show up as metric labels. It is often helpful to query metrics based on the custom label taxonomy that you use, be those resources that belong to an app, team, or environment.
To be able to query on custom labels, you can use a special metric provider, the
kube-state-metrics exporter that makes Kubernetes metadata available as Prometheus metrics. It picks up the custom pod labels and makes them available under the kube_pod_labels metric.
The app.kubernetes.io/instance Kubernetes label becomes the label_app_kubernetes_io_instance label on the kube_pod_labels metric. And it also knows about the pod name, stored in the pod label.
If we combine the mentioned two metrics, we will be able to query container_memory_working_set_bytes with a custom label filter.
container_memory_working_set_bytes{namespace='$namespace'}* on (pod) group_left(label_app_kubernetes_io_instance, namespace) kube_pod_labels{namespace='$namespace', label_app_kubernetes_io_instance=~'$app'}/1024/1024
The above query joins the metrics on the pod label. And it has two label based filters: one on namespace and one on label_app_kubernetes_io_instance.
Daily workflow tips
When an application metric doesn't show up in Prometheus
When you start out with Prometheus, you may find yourself in a situation where you instrumented your application, it has a /metrics endpoint, still, the metrics don’t show up in Prometheus. This chapter gives you a step-by-step debug technique to find the problem.
The first step is to validate that your application really has the desired metrics on the
/metricsendpoint. If that's the case, it's time to check what Prometheus sees from the scrape targets.Proxy Prometheus to your laptop, and navigate to http://localhost:9090//service-discovery to see the scrape targets. Next to each scrape target, you can see a status that indicates whether Prometheus was able to scrape the target, or an error message, if it couldn't reach it.
kubectl port-forward svc/prometheus-server 9090:80
- If your app is not among the targets, look at the configuration at http://localhost:9090/targets and verify if it has the latest config. If not, restart Prometheus to pick up the latest config.
- If service discovery has the latest configuration, check whether there's any requirement for your app to bfe scraped. If you used Gimlet Stack to set up Prometheus, your app must have two annotations to be scraped:
prometheus.io/port: "9999" # use the right port
prometheus.io/scrape: "true"
- If Prometheus attempted to scrape your app, but it faced a network error, try debugging the network connection between Prometheus and your app.
With the right config and network setup, your application metrics should show up in Prometheus.
A warning against high label cardinality
Each label combination represents a unique metric series. So beware of too many metric labels, especially high cardinality ones. A single metric name can easily grow to hundreds or thousands of metric series.
Take the prometheus_http_request_duration_seconds_bucket histogram metric for example. Without any labels, it has 10 buckets, as described in the Histograms section. But the metric has a handler label as well, which contains the endpoint we record metrics for. Let's say an application has 10 endpoints, that makes it 10 times 10, 100 unique metric series for just this metric. Add a couple more labels with low cardinality, let's say 3 each, that makes 10x10x3x3 unique combinations. 900 time series in total.
As a rule of thumb, make sure not to put any unique id into labels. A customer or user id would explode the number of metrics in Prometheus. Rendering it practically useless for querying.
Understanding metric relabeling and scrape configs
If you have used Kubernetes service discovery, you probably have seen how scrape configs look like. They have a bunch of cryptic entries under relabel_configs. At some point in your Prometheus journey, you have to touch these configs, and this chapter tries to make that experience smoother.
- job_name: 'kubernetes-pods'
  kubernetes_sd_configs:
    - role: pod
  relabel_configs:
    - source_labels: [__meta_kubernetes_pod_annotation_prometheus_io_scrape]
      action: keep
      regex: true
    - source_labels: [__meta_kubernetes_pod_annotation_prometheus_io_path]
      action: replace
      target_label: __metrics_path__
      regex: (.+)
    - source_labels: [__address__, __meta_kubernetes_pod_annotation_prometheus_io_port]
      action: replace
      regex: ([^:]+)(?::\d+)?;(\d+)
      replacement: $1:$2
      target_label: __address__
    - action: labelmap
      regex: __meta_kubernetes_pod_label_(.+)
    - source_labels: [__meta_kubernetes_namespace]
      action: replace
      target_label: kubernetes_namespace
    - source_labels: [__meta_kubernetes_pod_name]
      action: replace
      target_label: kubernetes_pod_name
Relabeling is a powerful tool to dynamically rewrite the label set of a target before it gets scraped.
This definition could lead you to think that you can tailor the labels before you store them in Prometheus, but it doesn't tell you that there are more to labels. There are predefined labels like __address__ that holds the scrape target's address, and a few others that control if and how metrics from a target should be stored.
Let's go through the above shown scrape config, and examine each relabel config:
Drop metrics from scrape targets that are not annotated by prometheus.io/scrape: true
- source_labels: [__meta_kubernetes_pod_annotation_prometheus_io_scrape]
  action: keep
  regex: true
This one takes the __meta_kubernetes_pod_annotation_prometheus_io_scrape label that was read by the Kubernetes service discovery mechanism. The service discovery reads all annotations that present on pods, and this one stores the pod annotation prometheus.io/scrape.
It defines a keep action with regex: true, meaning it will only keep metrics that are coming from pods that are annotated with prometheus.io/scrape: "true"
Configuring metrics scrape path
- source_labels: [__meta_kubernetes_pod_annotation_prometheus_io_path]
  action: replace
  target_label: __metrics_path__
  regex: (.+)
This one also reads a pod annotation, namely prometheus.io/path from the pod, and replaces an existing label with its value. The existing label __metrics_path__ is a predefined one that controls the scraping in Prometheus. Therefore, this relabeling allows the fine-tuning of the metrics path with pod annotations..
info
Predefined labels are
The
__address__label is set to the host:port address of the target. The instance label is set to the value of__address__by default, if it was not set during relabeling. The__scheme__and__metrics_path__labels are set to the scheme and metrics path of the target respectively. The __param_name label is set to the value of the first passed URL parameter called name.
Configuring the metrics scrape port
- source_labels: [__address__, __meta_kubernetes_pod_annotation_prometheus_io_port]
  action: replace
  regex: ([^:]+)(?::\d+)?;(\d+)
  replacement: $1:$2
  target_label: __address__
This one uses two source labels: the first holds the host and port address of the scrape target, the second is the value of the prometheus.io/port pod annotation.
It uses the replace action with the a regex that cuts the port from __address__ and replaces it with the port from the annotation.
Store all Kubernetes labels as Prometheus labels
- action: labelmap
  regex: __meta_kubernetes_pod_label_(.+)
The labelmap action simply copies all labels that match the regex. The above regex copies all pod labels to the metric that was discovered by the Kubernetes service discovery.
Keep namespace as label
- source_labels: [__meta_kubernetes_namespace]
  action: replace
  target_label: kubernetes_namespace
- source_labels: [__meta_kubernetes_pod_name]
  action: replace
  target_label: kubernetes_pod_name
The final two relabel configs simply put the Kubernetes namespace and pod names into their own label on the metric.
Day-two operations
Federation
It is common to have each cluster run a Prometheus that collects a vast amount of metrics. From those metrics, only a subset is then pushed to a central Prometheus.
With this setup, you achieve broad visibility of all your clusters, and get the option to dig deeper on per cluster metrics, should you need more metrics for debugging.
This could be achieved by remote metric shipping. You configure a remote write target, and ship selected metrics to this aggregate Prometheus instance. It’s fairly common to use a Grafana Cloud for this remote, federated Prometheus instance. Jump to the Grafana Cloud chapter to see how remote_write and aggressive metric filtering can be achieved.
High Availability (HA)
Prometheus has a simplistic approach to High Availability (HA): you need to run multiple instances of Prometheus with the exact same configuration. The idea is that if they scrape the same targets, they will have the same metrics.
This is easy to set up, but there are practical problems with this approach. Since the scraping of the Prometheus instances are not synchronized, they see a slightly different view of the world. To overcome this, use sticky sessions (using sessionAffinity on a Kubernetes Service) to get consistent graphs when refreshing.
It is also worth checking out the Thanos project if you are looking for a scalable version of Prometheus.
Custom metrics from your apps
Besides the many off-the-shelf exporters that exist for Prometheus, you typically want to have metrics from your custom applications as well.
There is a Prometheus library for every language, and they all look similar to the Golang Prometheus client. First, they expose a web endpoint on /metrics:
package main

import (
        "net/http"

        "github.com/prometheus/client_golang/prometheus/promhttp"
)

func main() {
        http.Handle("/metrics", promhttp.Handler())
        http.ListenAndServe(":2112", nil)
}
Then, they use well-known data structures, counters, gauges and histograms, to expose the metrics. requestsTotal is a Prometheus counter that we increase every time the endpoint was called with requestsTotal.Inc(). Don’t forget that you can use the rate function with counters to get a meaningful chart.
package main

import (
        "net/http"
        "time"

        "github.com/prometheus/client_golang/prometheus"
        "github.com/prometheus/client_golang/prometheus/promauto"
        "github.com/prometheus/client_golang/prometheus/promhttp"
)

var (
        requestsTotal = promauto.NewCounter(prometheus.CounterOpts{
                Name: "myapp_http_requests_total",
                Help: "The total number of times and endpoint was called",
        })
)

func main() {
        http.Handle("/metrics", promhttp.Handler())
        http.Handle("/my-api-endpoint", func (w http.ResponseWriter, req *http.Request){
          requestsTotal.Inc()
          // do something useful in the endpoint
        })
        http.ListenAndServe(":2112", nil)
Installation
There are different ways to install Prometheus. This chapter is a non-exhaustive list of these methods with a few pointers so you can orient yourself.
Using the Prometheus Helm chart
This is the most straightforward way and the least opinionated one. See the Helm chart.
Using the Prometheus operator project
This is an opinionated installation method of Prometheus.
Besides installation, it also provides a set of custom resources (CRDs) that allow you to configure Prometheus scraping.
Gimlet Stack
Gimlet Stack is using the Prometheus Helm chart with a few default configurations. It also packs a set of Grafana dashboards described in the Grafana section.